


This guide is part of the Google Docs series
1.
Auto fit column width in Google docs spreadsheets
2. Change a date in a Google doc spreadsheet cell
3. Change the hyperlink color in a docs document
4. Change the slide speed in Google Docs presentation
5. Convert Google docs spreadsheet into a PDF file
6. Convert Google docs spreadsheet into an Excel file
7. Freeze top row when scrolling in Google Docs
8. How to add a bookmark in Google Docs
9. How to add a cell border in Google Sheets
10. How to add a column to a google docs spreadsheet
Make: Google
Model / Product: Sheets
Version: 2024
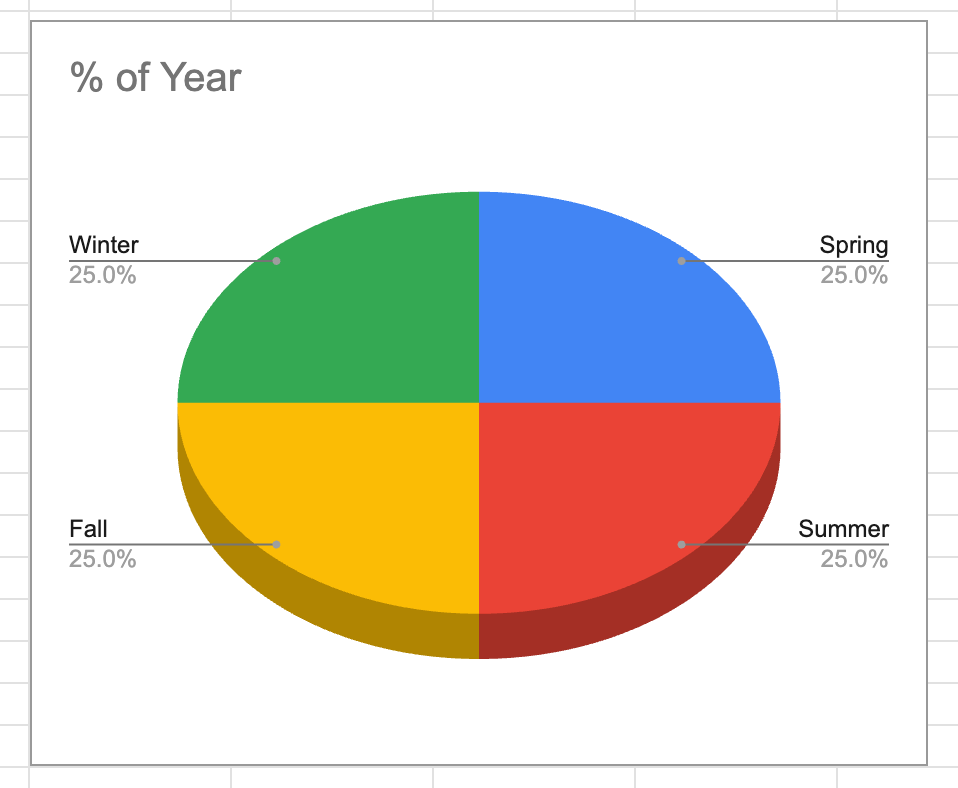
Objective / Info: Learn how to create a pie chart in Google Sheets.
Model / Product: Sheets
Version: 2024
Objective / Info: Learn how to create a pie chart in Google Sheets.
1
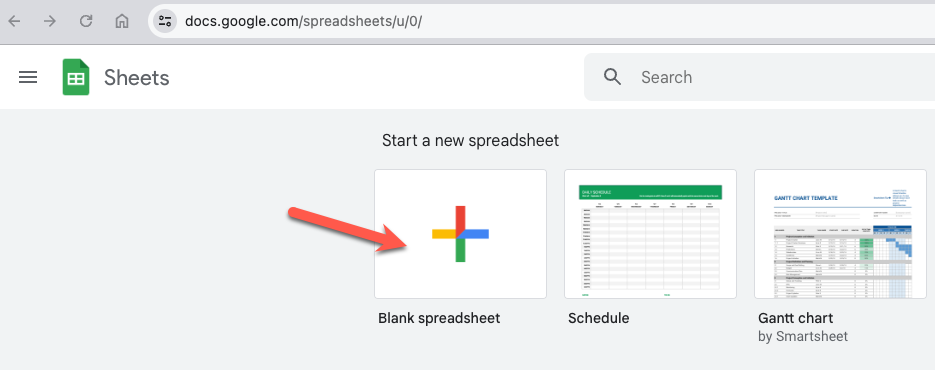
Open Google Sheets by visiting https://docs.google.com/spreadsheets and sign in using your Google account. Note :Any Google Account will do. E.g. Gmail, YouTube, etc.
2
In the upper left-hand corner, click the "Blank spreadsheet" button.
3
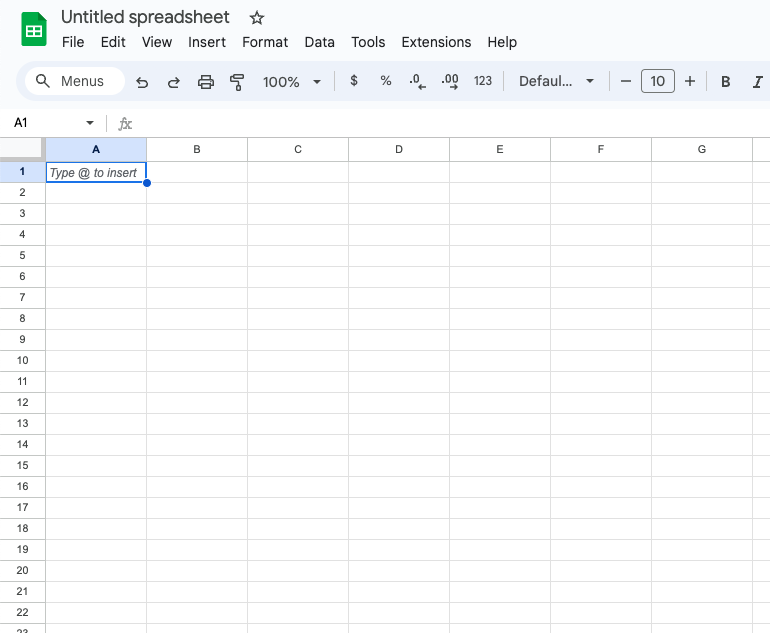
You should see a blank new sheet.
4
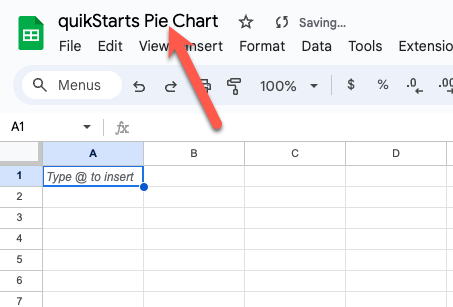
Rename the spreadsheet by clicking the area labeled "Untitled spreadsheet"
Note :
We used "quikStarts Pie chart" for this guide.
5
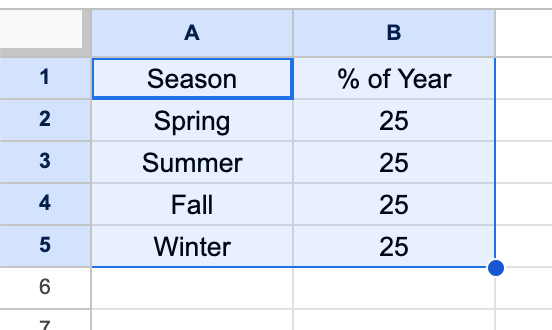
Populate the data into the cells as pictured.
6
Select the spreadsheet data that will be contained in the chart. You select by pressing the left-click button on the mouse while over cell "A1" and holding it while you drag it across the data you want to select.
Note :
After all of your data is selected, release the left mouse

7
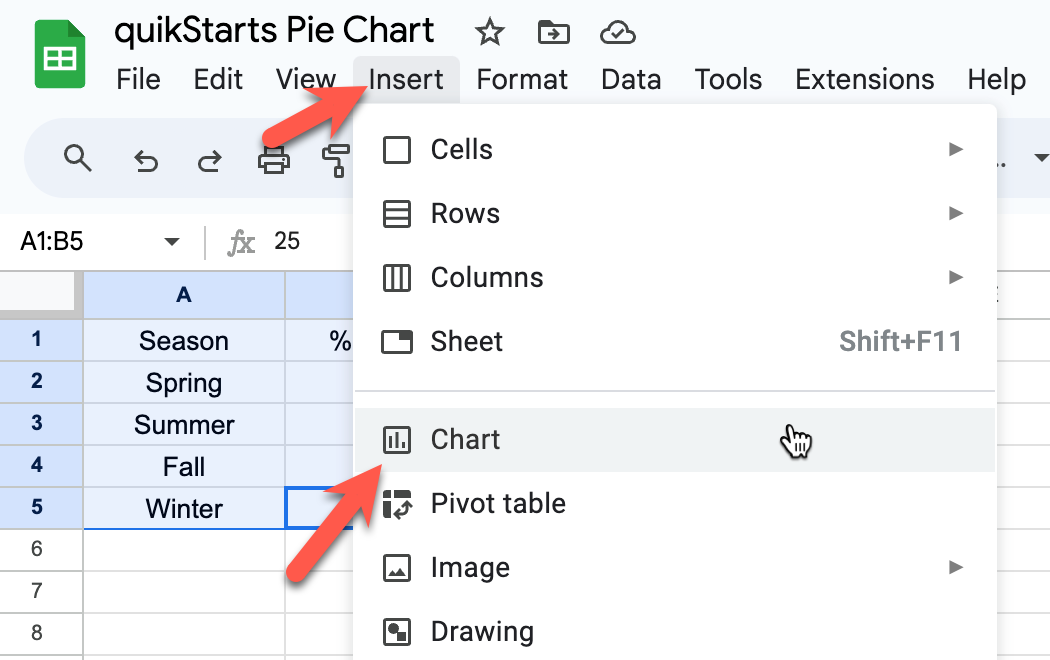
Click on the "Insert" button on the menu bar and then select "Chart"
8
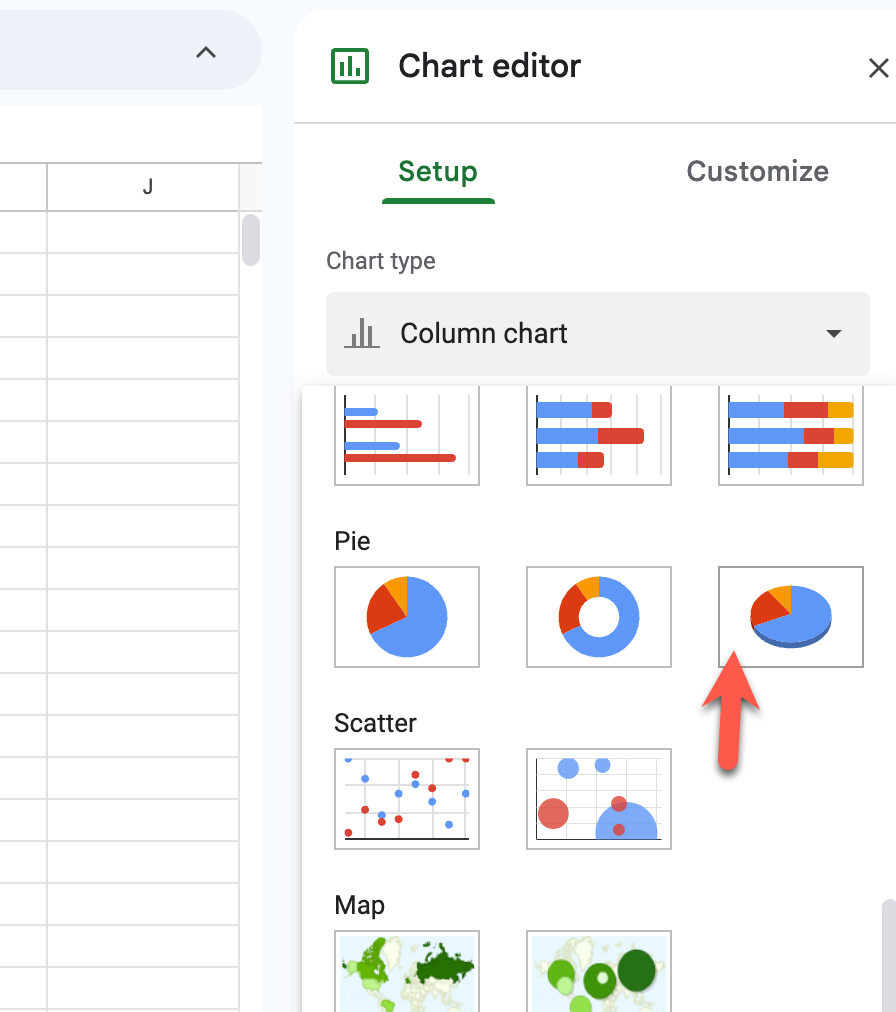
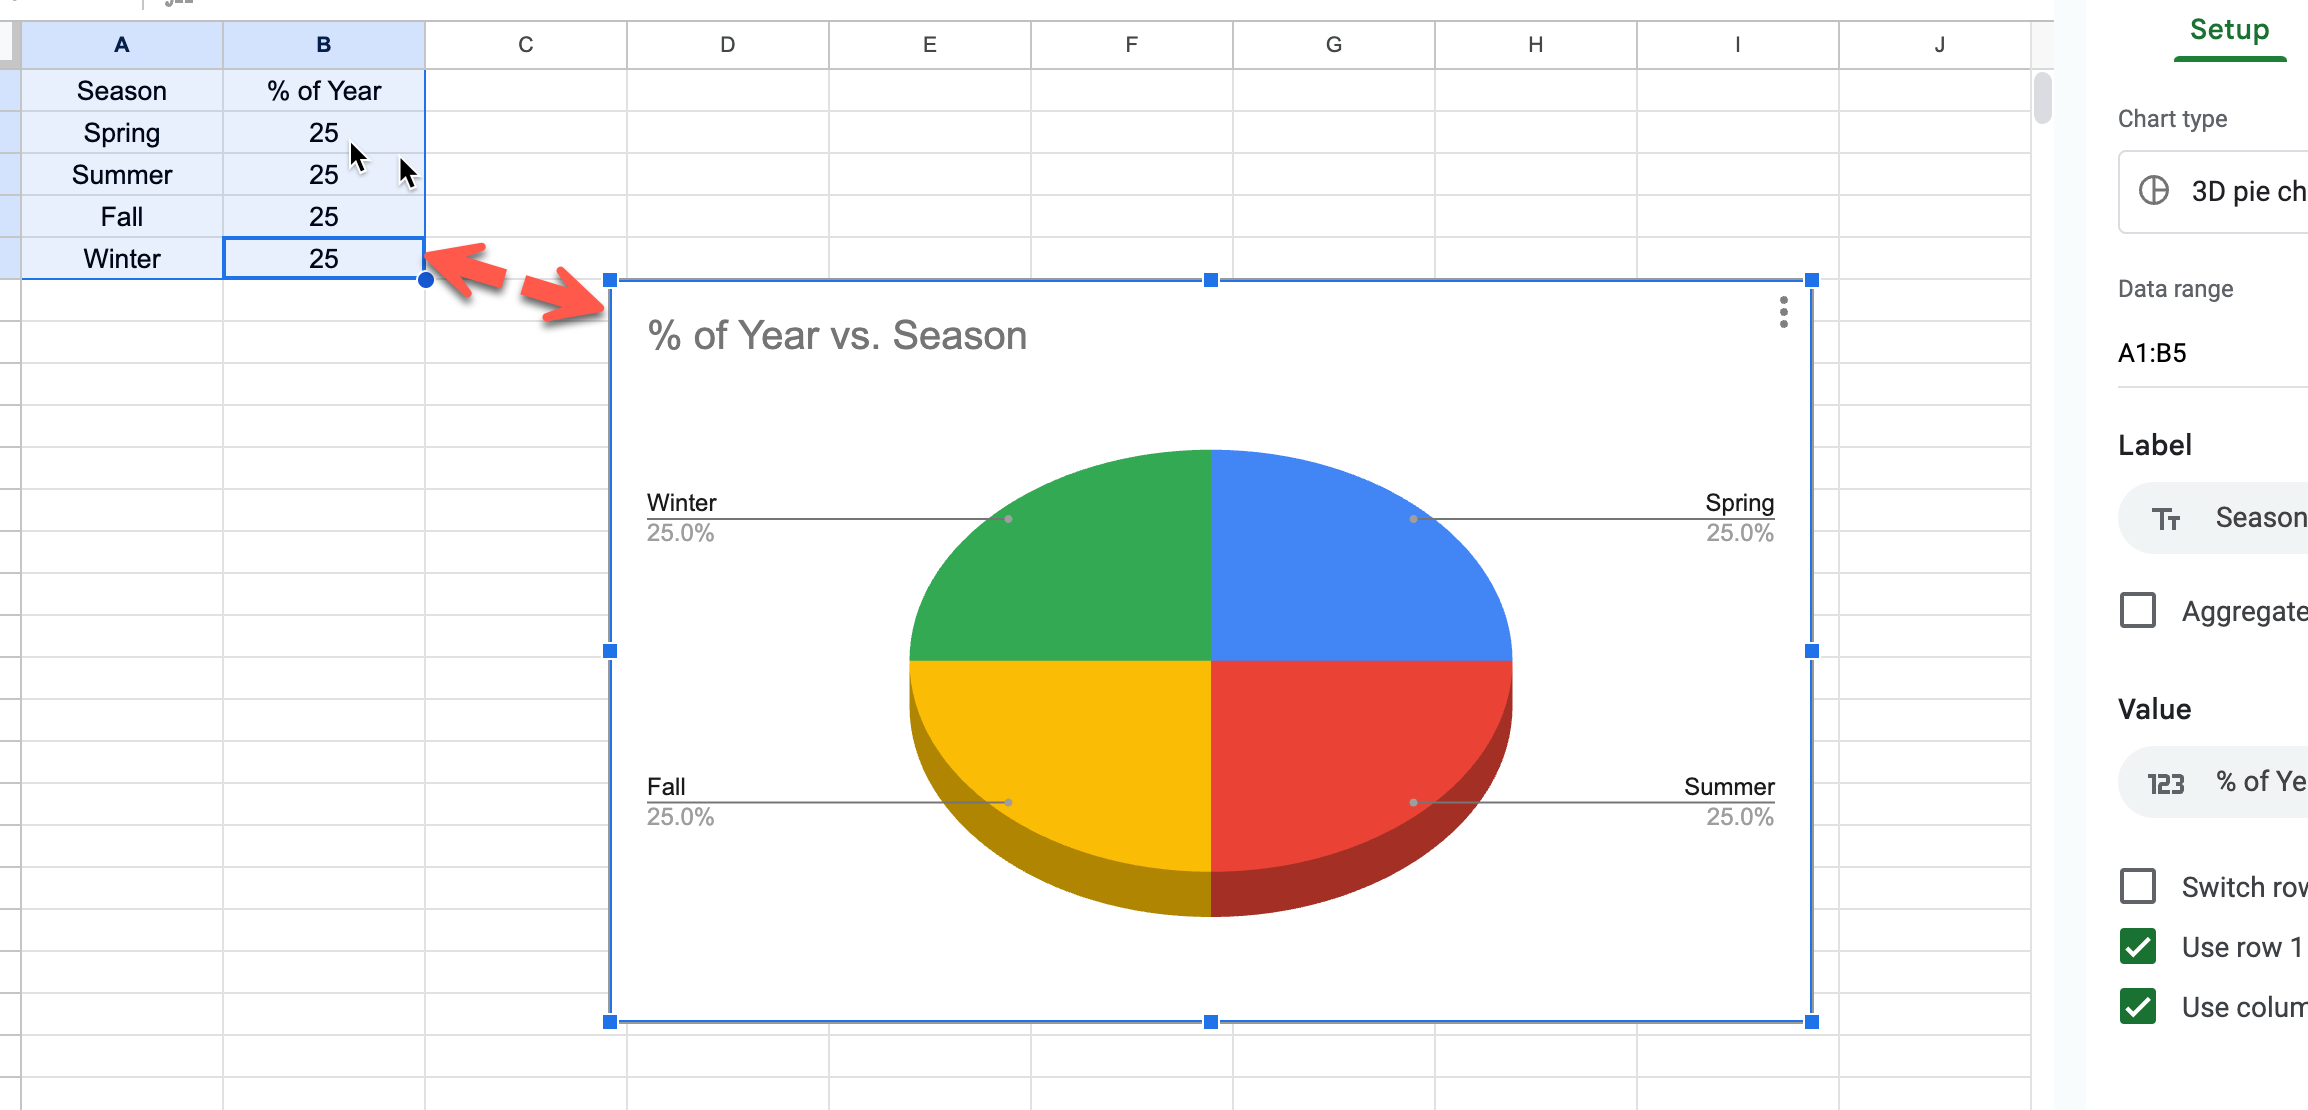
A chart editor should appear to the right displaying options. Select the 3D pie chart. Note :
You may need to scroll down the page.
9
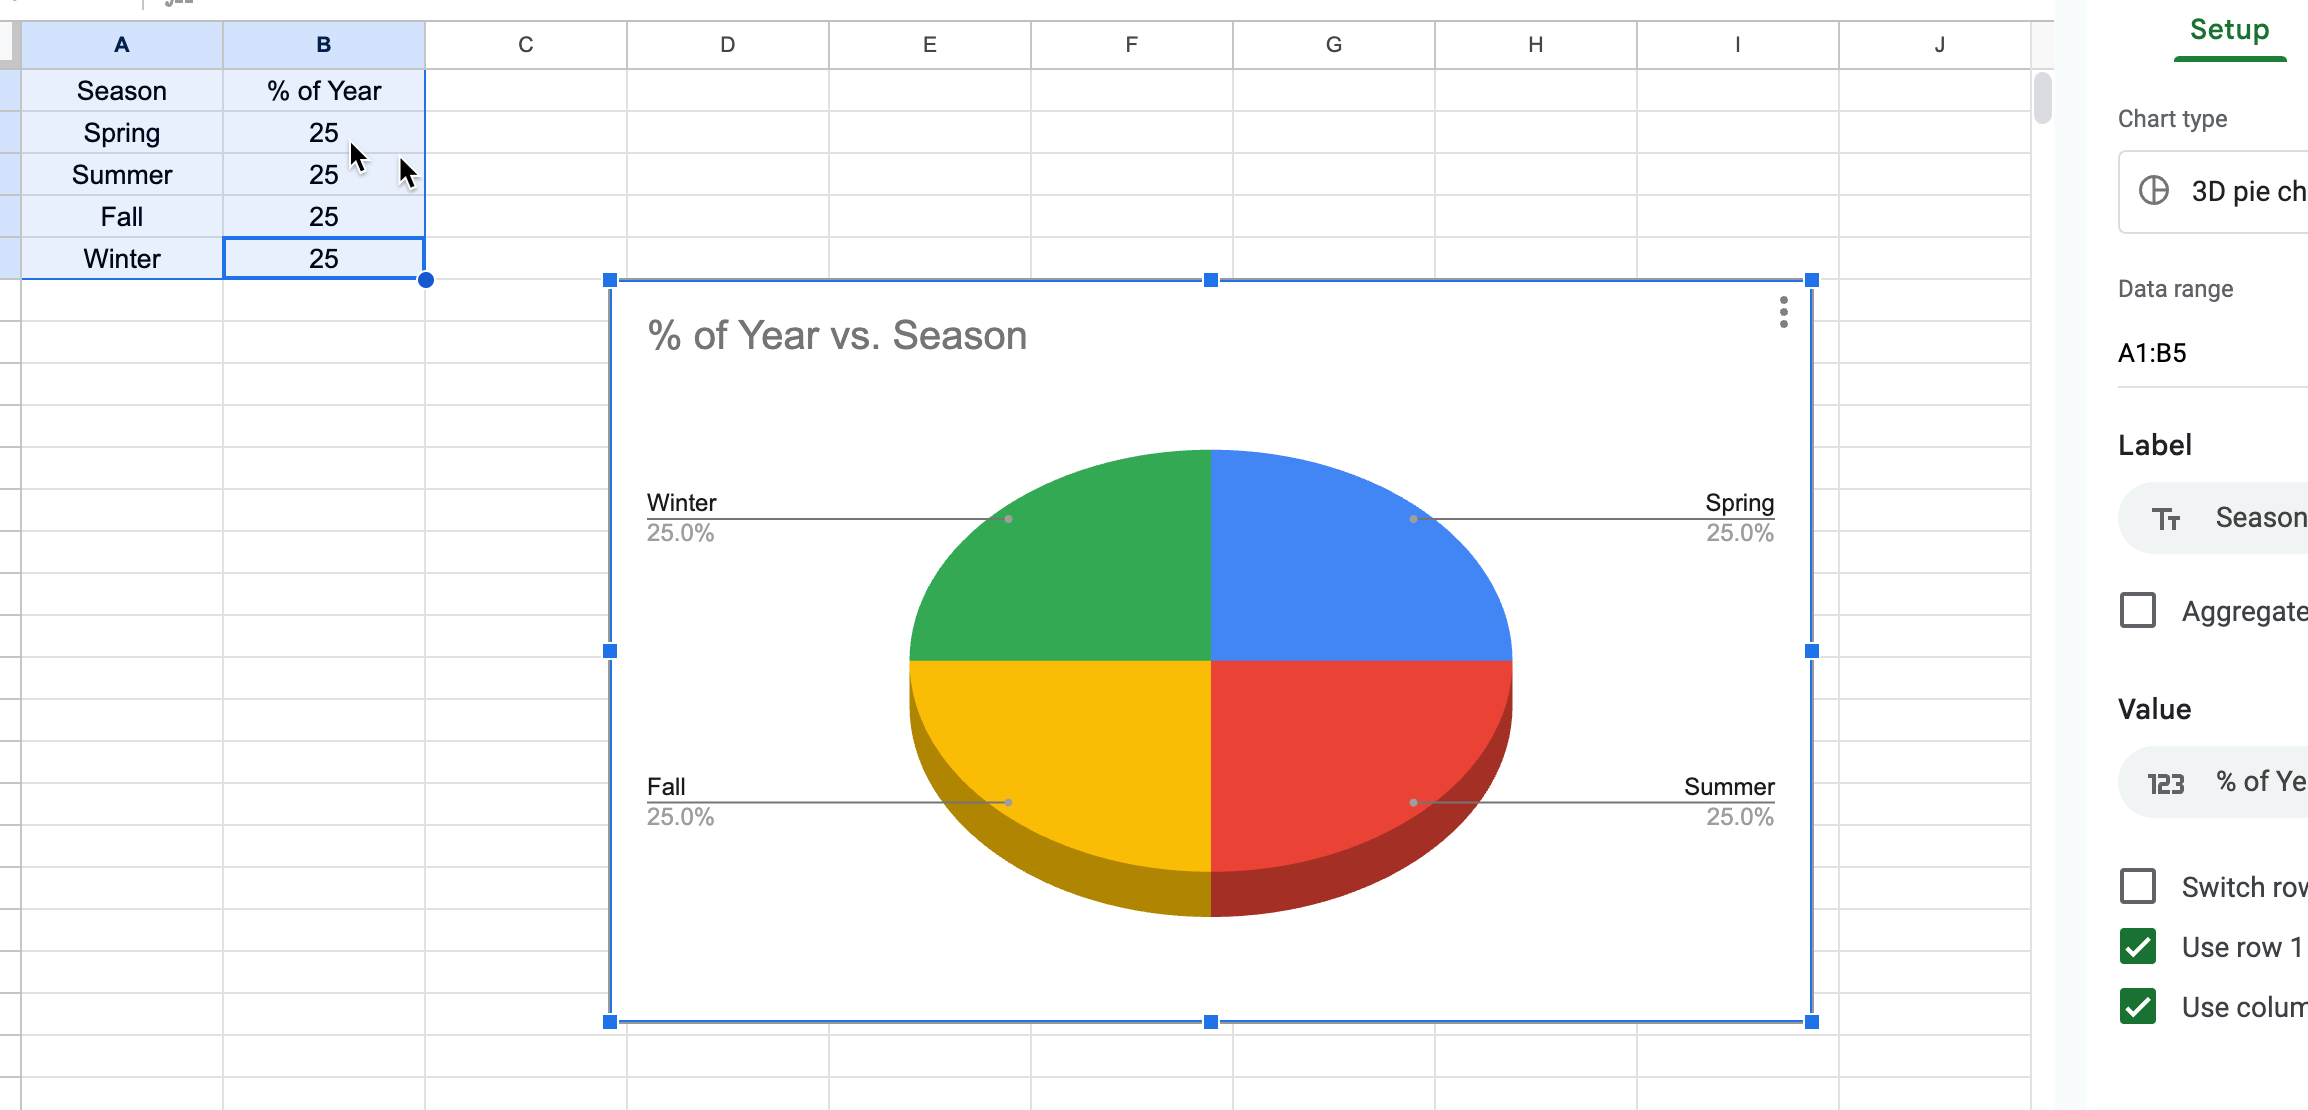
The chart should be inserted into your spreadsheet with relevant data already populated.
10
If the chart is covering your data and you want to move it, click on any white space in the chart and drag the chart to another part of the spreadsheet.
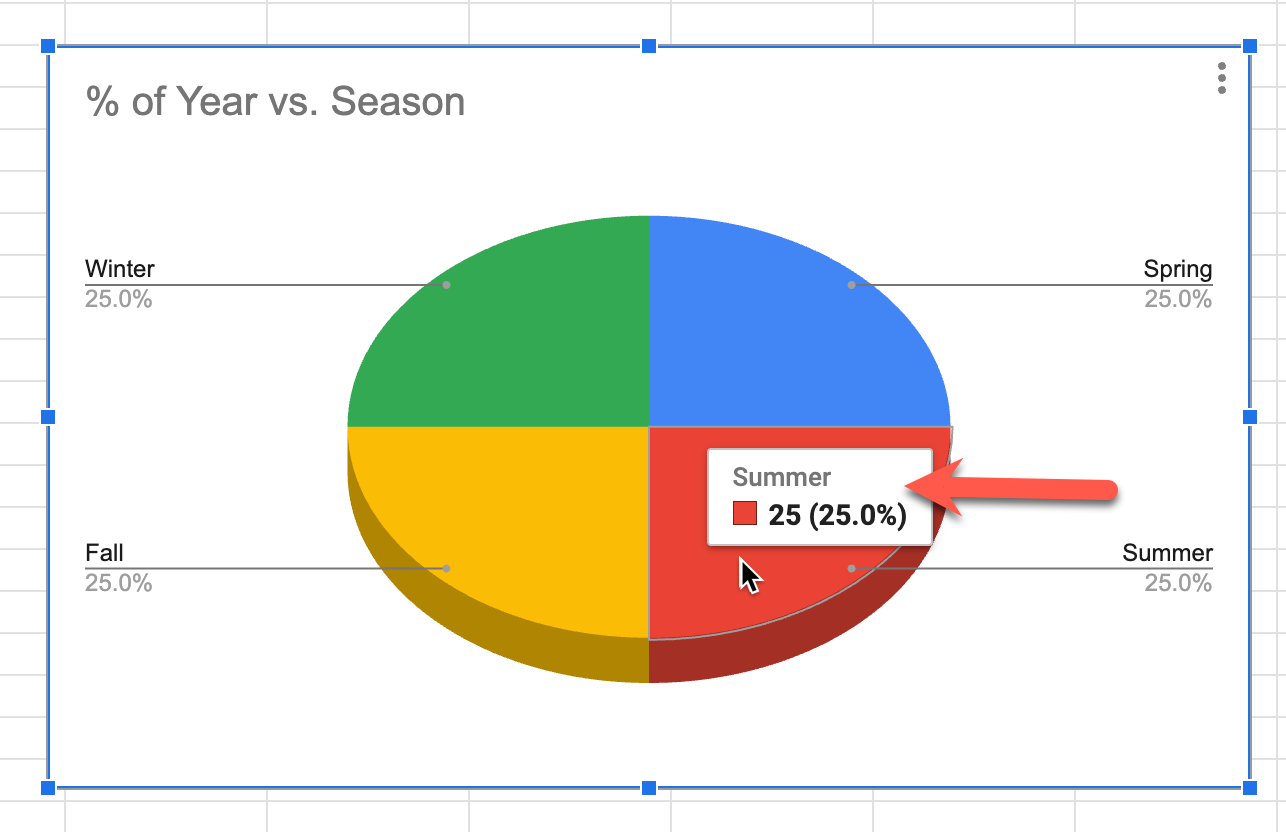
11
Clicking on a piece of the pie will show an annotation that represents that piece.
The Google Sheet used for this guide can be found at https://docs.google.com/spreadsheets/d/1InCwHX9JTi-5zkGA085B2MXSxyK_x12jskw612huguo/edit?usp=sharing
comments powered by Disqus
 Ask a question or provide an answer